Monday, December 5, 2016

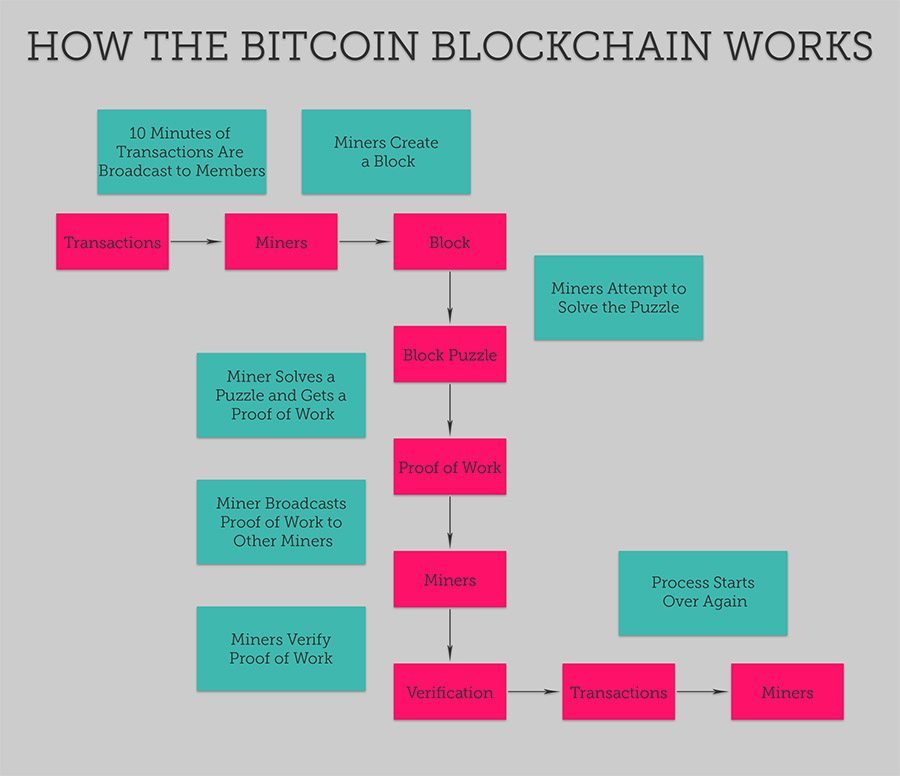
Demystifying Blockchains

By now, you've probably heard about Bitcoins (BTC), the new cryptocurrency, and are as confused as most of the others who have - or worse, haven't! The bitcoin is rising in popularity, and is increasingly being seen as a currency of the future, and retailers have also begun considering them legal tender as alternatives to other thus-far common forms of payment in the online world.

Well, bitcoin is much more complicated than that (the link above may help), and there's more to it, than just the currency bit. Bitcoin is catching the eye of financial service companies (read: banks) the world over, for more than this, and for something called as 'Blockchain'. This is what makes bitcoin what it is - and it's something that these companies are now vying to adopt.

There's still a long way to go, but, it could help to get your grey cells thinking about this, as it's only a matter of time before it'll become more mainstream!

Here, we attempt to try and demystify blockchains.

Source: napkinfinance.com


Thursday, June 2, 2016

[Infographic] Javascript Frameworks - Choosing One, and their Future (2016)


Javascript has become the star of the current generation of digital technologies, and yet, it is never spoken of in the world of SMAC!! (Social - Mobile - Analytics - Cloud). To give it true credit, probably a new acronym needs to be coined - JSMAC! (We'll admit, we haven't checked if there already is one).

Javascript, has always been a versatile, and powerful language, that powered the early, dynamic web. But, it, along with it's close friends, CSS and HTML, have advanced tremendously over the past decade, and is what makes your digital experience on any device today so awesome.

However, if you're on the other - read, developer - side of this, then, it can be more than a tad challenging to choose from a multitude of Javascript Frameworks available out there.

So, while this infographic can help you to consider various aspects to begin with, also checkout some useful links below.


(Source: webdesigndegreecenter.org)

Also see these informative articles:
Overview of the Javascript Ecosystem
Beyond jQuery - Expert Guide to Javascript Frameworks
What to expect from Javascript in 2016


Tuesday, April 12, 2016

The Periodic Table of DevOps Tools

DevOps - the portmanteau of "Development" and Operations" has become a rage in the tech industry. It's almost like the secret sauce for today's digital businesses.

To know about the origins of DevOps, please read our earlier post on 'The History & State of DevOps'.

While DevOps is being increasing chosen as the method of choice, to bring in the ever wanted agility for business, it's really not a one size fits all. DevOps is a blend of multiple practices, refined over the years, through hardened processes and tools, many born of necessity, since the means of the past 3-5 decades are not adequate to meet the demands of the digital age.


So, in this next post on the topic, we present the awesome* periodic table of DevOps Tools that can - and are - emerging, and enabling the digital economy of today.

(*Source: www.xebialabs.com)


Monday, February 29, 2016

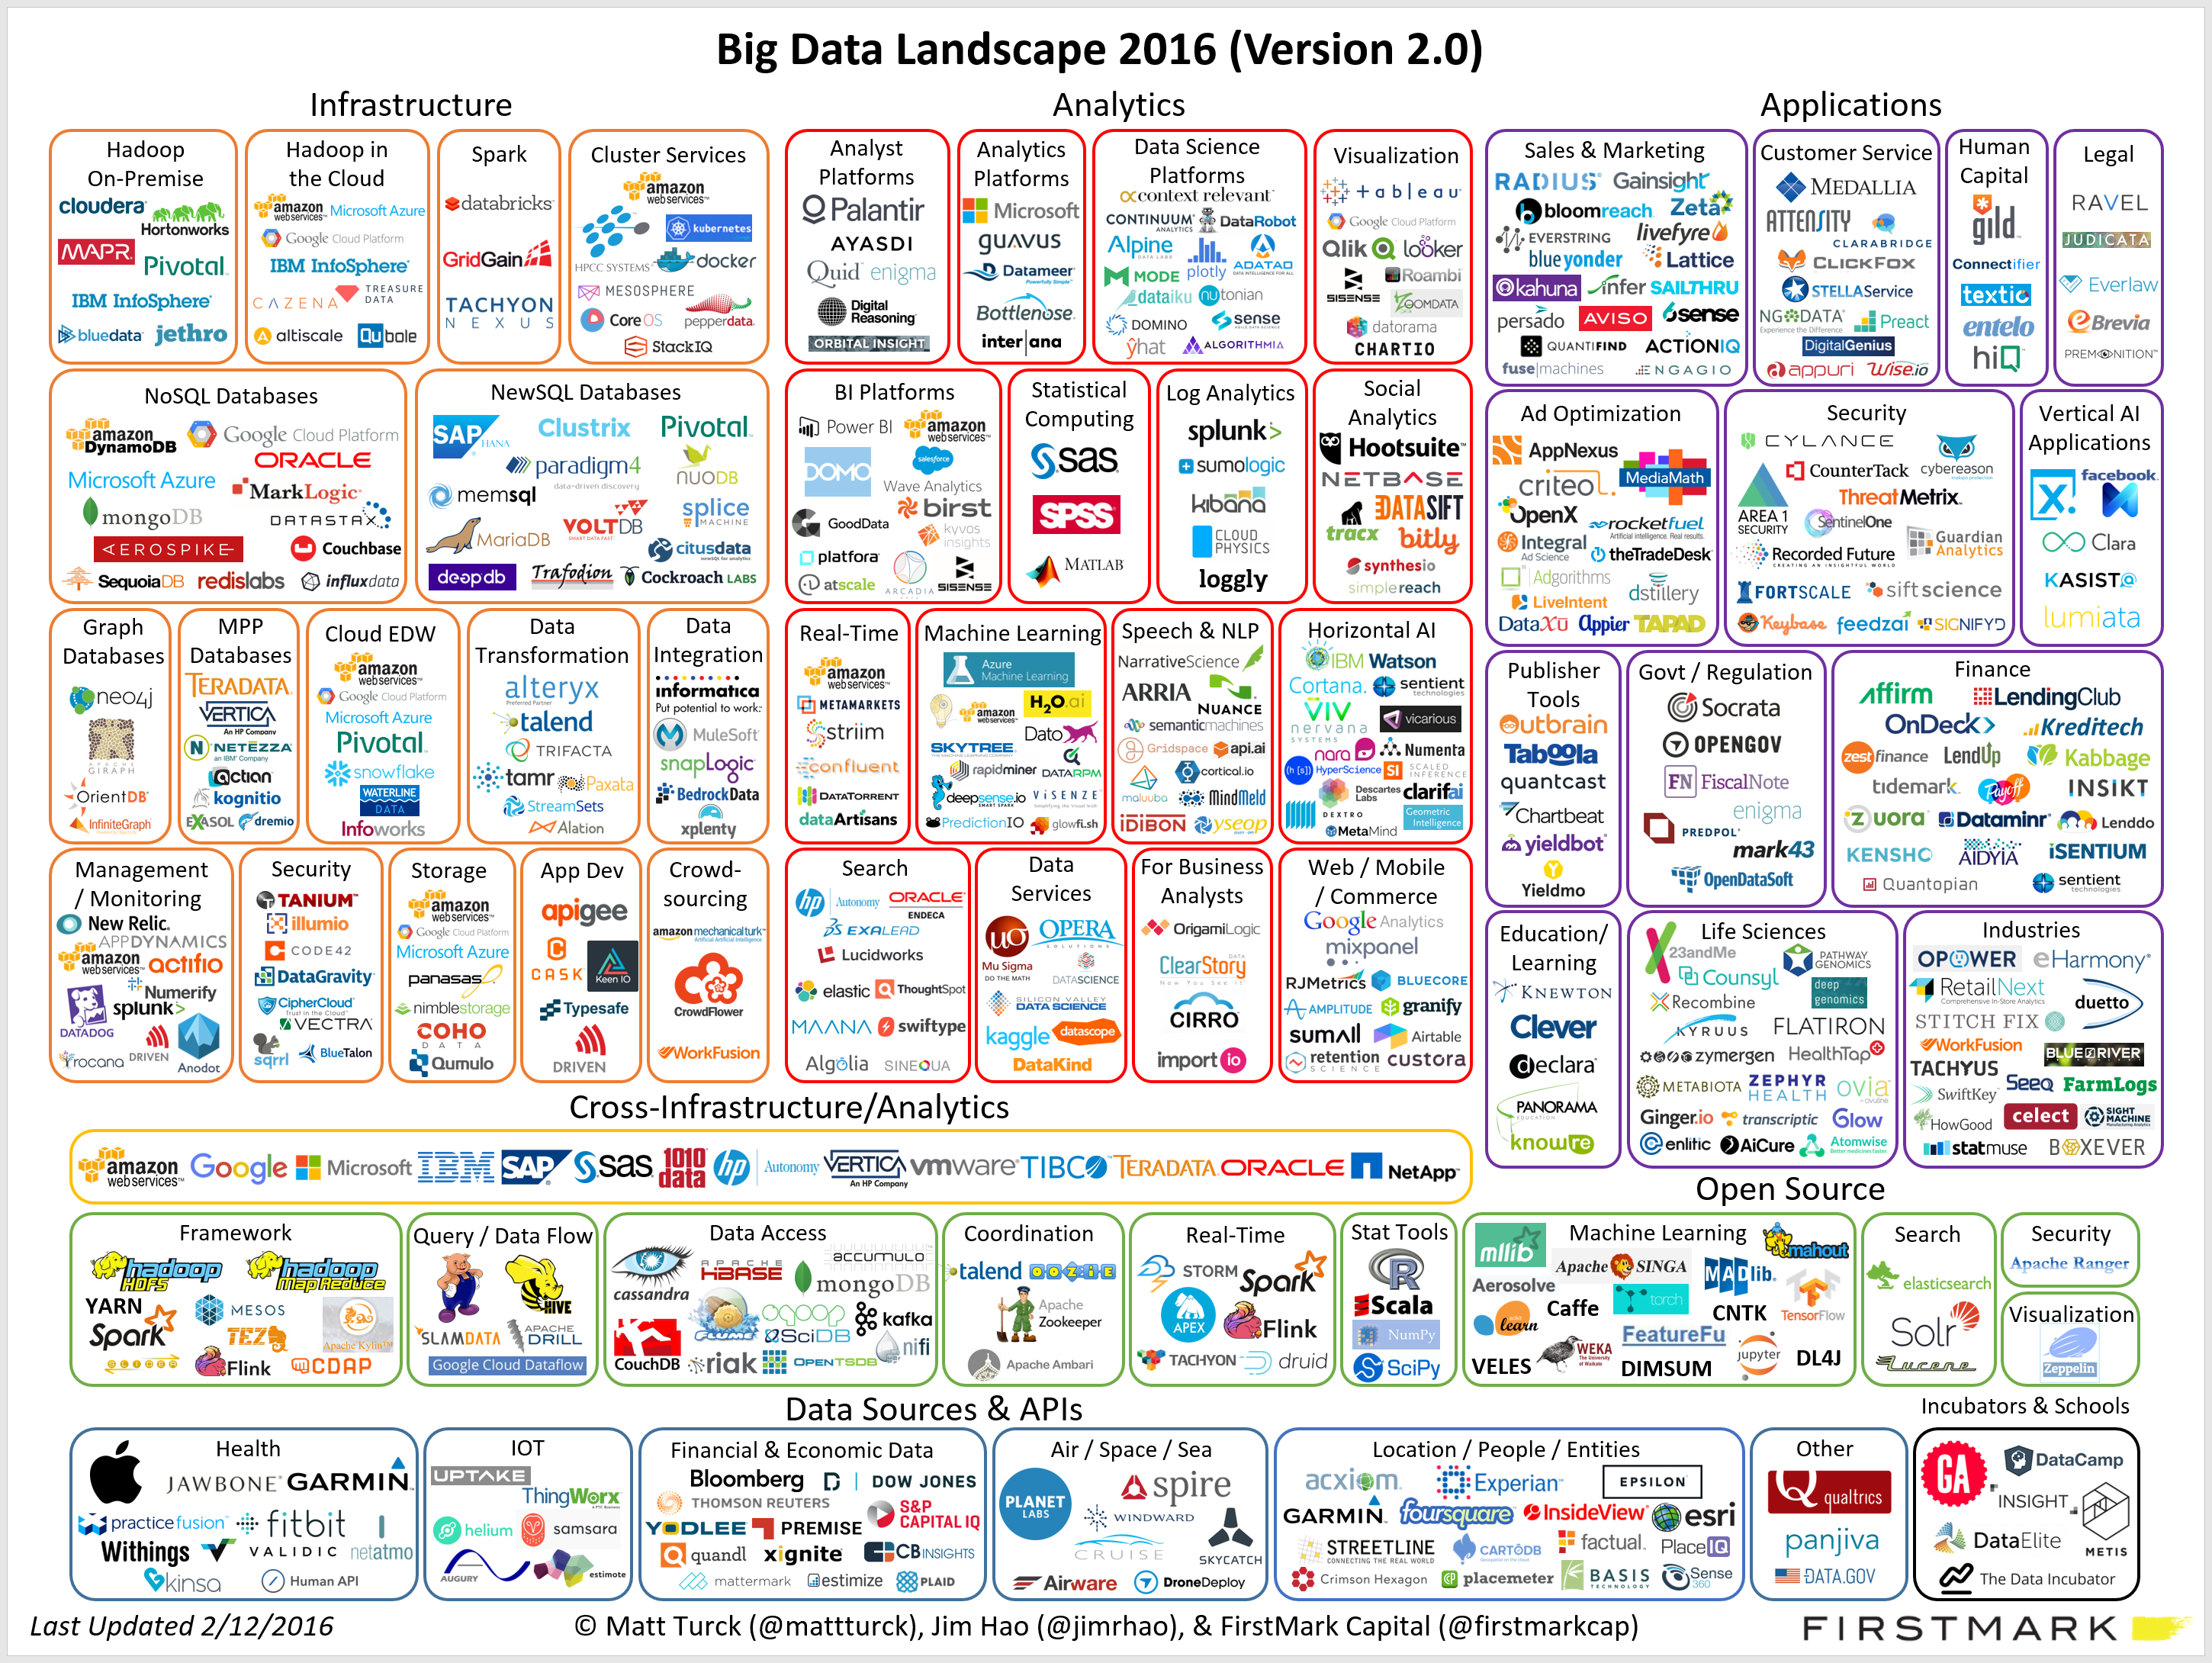
[Infographic] Big Data Landscape 2016

Big Data is here to stay, and there's a whole lot going on. This busy infographic depicts it well!!


Friday, February 5, 2016

[Infographic] The History & State of DevOps

DevOps, a portmanteau of "development" and "operations" is a method, culture or practice, that emphasizes collaboration and communication of both software developers and other IT professionals while automating software delivery.

With the shift towards an increasingly "digital-ized" world, powered by cloud computing and any/mobile devices, industries are faced with challenges to meet the ever growing expectations of an always-on, creative and choice-enabled customers. All this calls for new ways of realizing business agility, enabled by digital technologies. Traditional approaches to delivery and maintenance are no longer able to serve the rapid pace of business today, and that's where DevOps is seeing an emergence.

Before knowing what the state of DevOps is, it also is good to delve a bit into the History of DevOps.

History of DevOps, via pinterest.com


Saturday, October 10, 2015

[Video] Big Data Architecture Patterns

So, well, data is the new oxygen. The creation of data has been growing at an unprecedented pace and is only going to continue to grow exponentially. The age of big and bigger data is here to stay, and architects, technologists and scientists have to learn and apply new architecture patterns to sustain this. Big Data is as much, if not more, a problem, than it is a solution in itself.

This tech talk on Big Data Architectures from CernerEng provides interesting insights into this space.


Sunday, August 30, 2015

[Link] High Performance Images - Beautiful Shouldn’t Mean Slow

Excerpt:

The web is becoming increasingly image rich. Between high-resolution mobile screens, Pinterest-style design and big background graphics, the average image payload has more than doubled in the last three years. While visually appealing, these images carry a substantial performance cost, and — if not optimized correctly — can make a web experience slow and painful, no matter how beautiful it is.
In this prelude webinar to the upcoming "High Performance Images" book, we'll discuss the ways you can provide the eye-pleasing experience you want without sacrificing your sites performance.
You'll learn about the three primary aspects of image optimization:
  • Image Compression: How to best encode your images, delivering the same picture with the fewest bytes.
  • Image Loading: Once your files are as small as they can be, we'll cover the best ways to make them show up quickly in the browser.
  • Operationalizing Image Optimization: Different tools and techniques for integrating image optimization on your site.
Click below (or here) to access this interesting webcast.


Sunday, June 14, 2015

[Infographic] The Future of the Internet of Things

The excitement (and reality) of the Internet of Things (IoT) is growing by the day. Well, yes, there's hype, but companies like Google are also gearing up for this to make way for a ubiquitously connected planet.

So, if you've understood what the Internet of Things (IoT) is, then it can also be helpful to start thinking of what the future of IoT will entail. The infographic below depicts that.


Wednesday, January 7, 2015

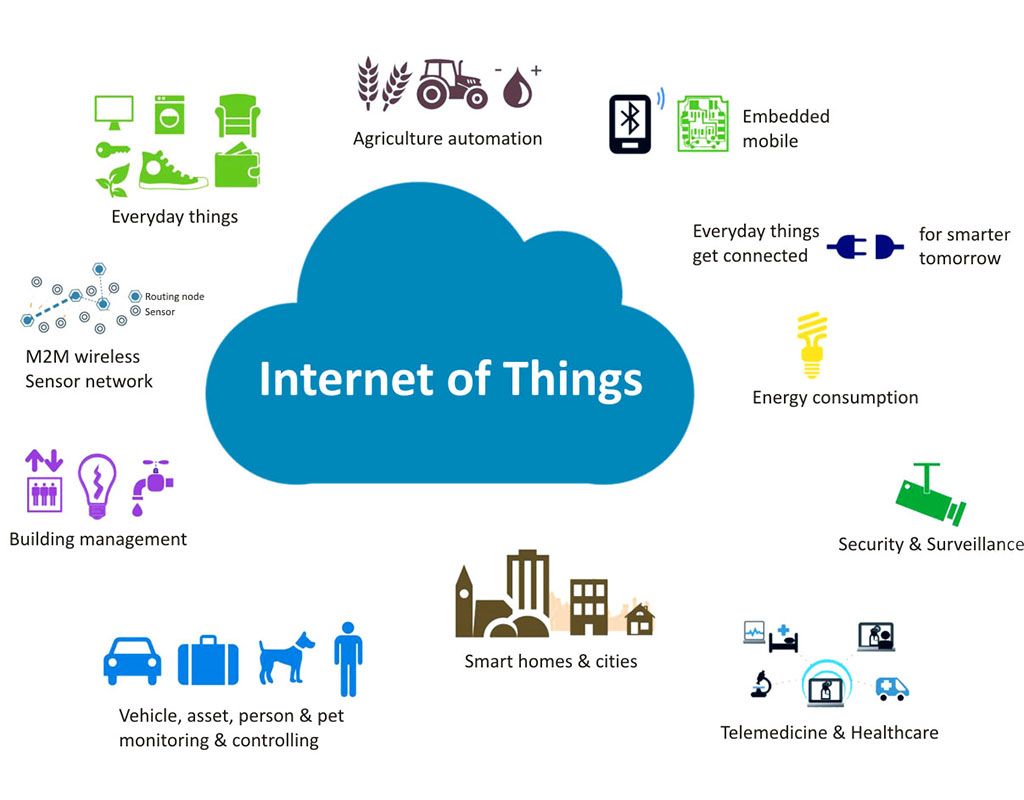
[Infographic] Understanding the Internet of Things (IoT)


Continuing our series on the buzzing topic of Internet of Things (IoT), here's a deeper look into what and how this trend is expected to manifest itself in our lives, and the areas that will see it applied to provide a smarter and more interconnected experience to users in the entire process chain.


(Ctrl + Click to enlarge)

Saturday, December 27, 2014

[Infographic] The Internet of Things - The Past, The Present and the Future


Internet of Things - Popular Uses
The explosion of devices that are getting smarter, is taking us into a never before imagined future. According to wikipedia,
"The Internet of Things (IoT)" is the interconnection of uniquely identifiable embedded computing devices within the existing internet infrastructure..." (read more).

This is enabling a newer and smarter world, where any device can communicate with any other, anyone can connect to anyone else (possibly, not just humans), and all this is expected to make the world better in some way.

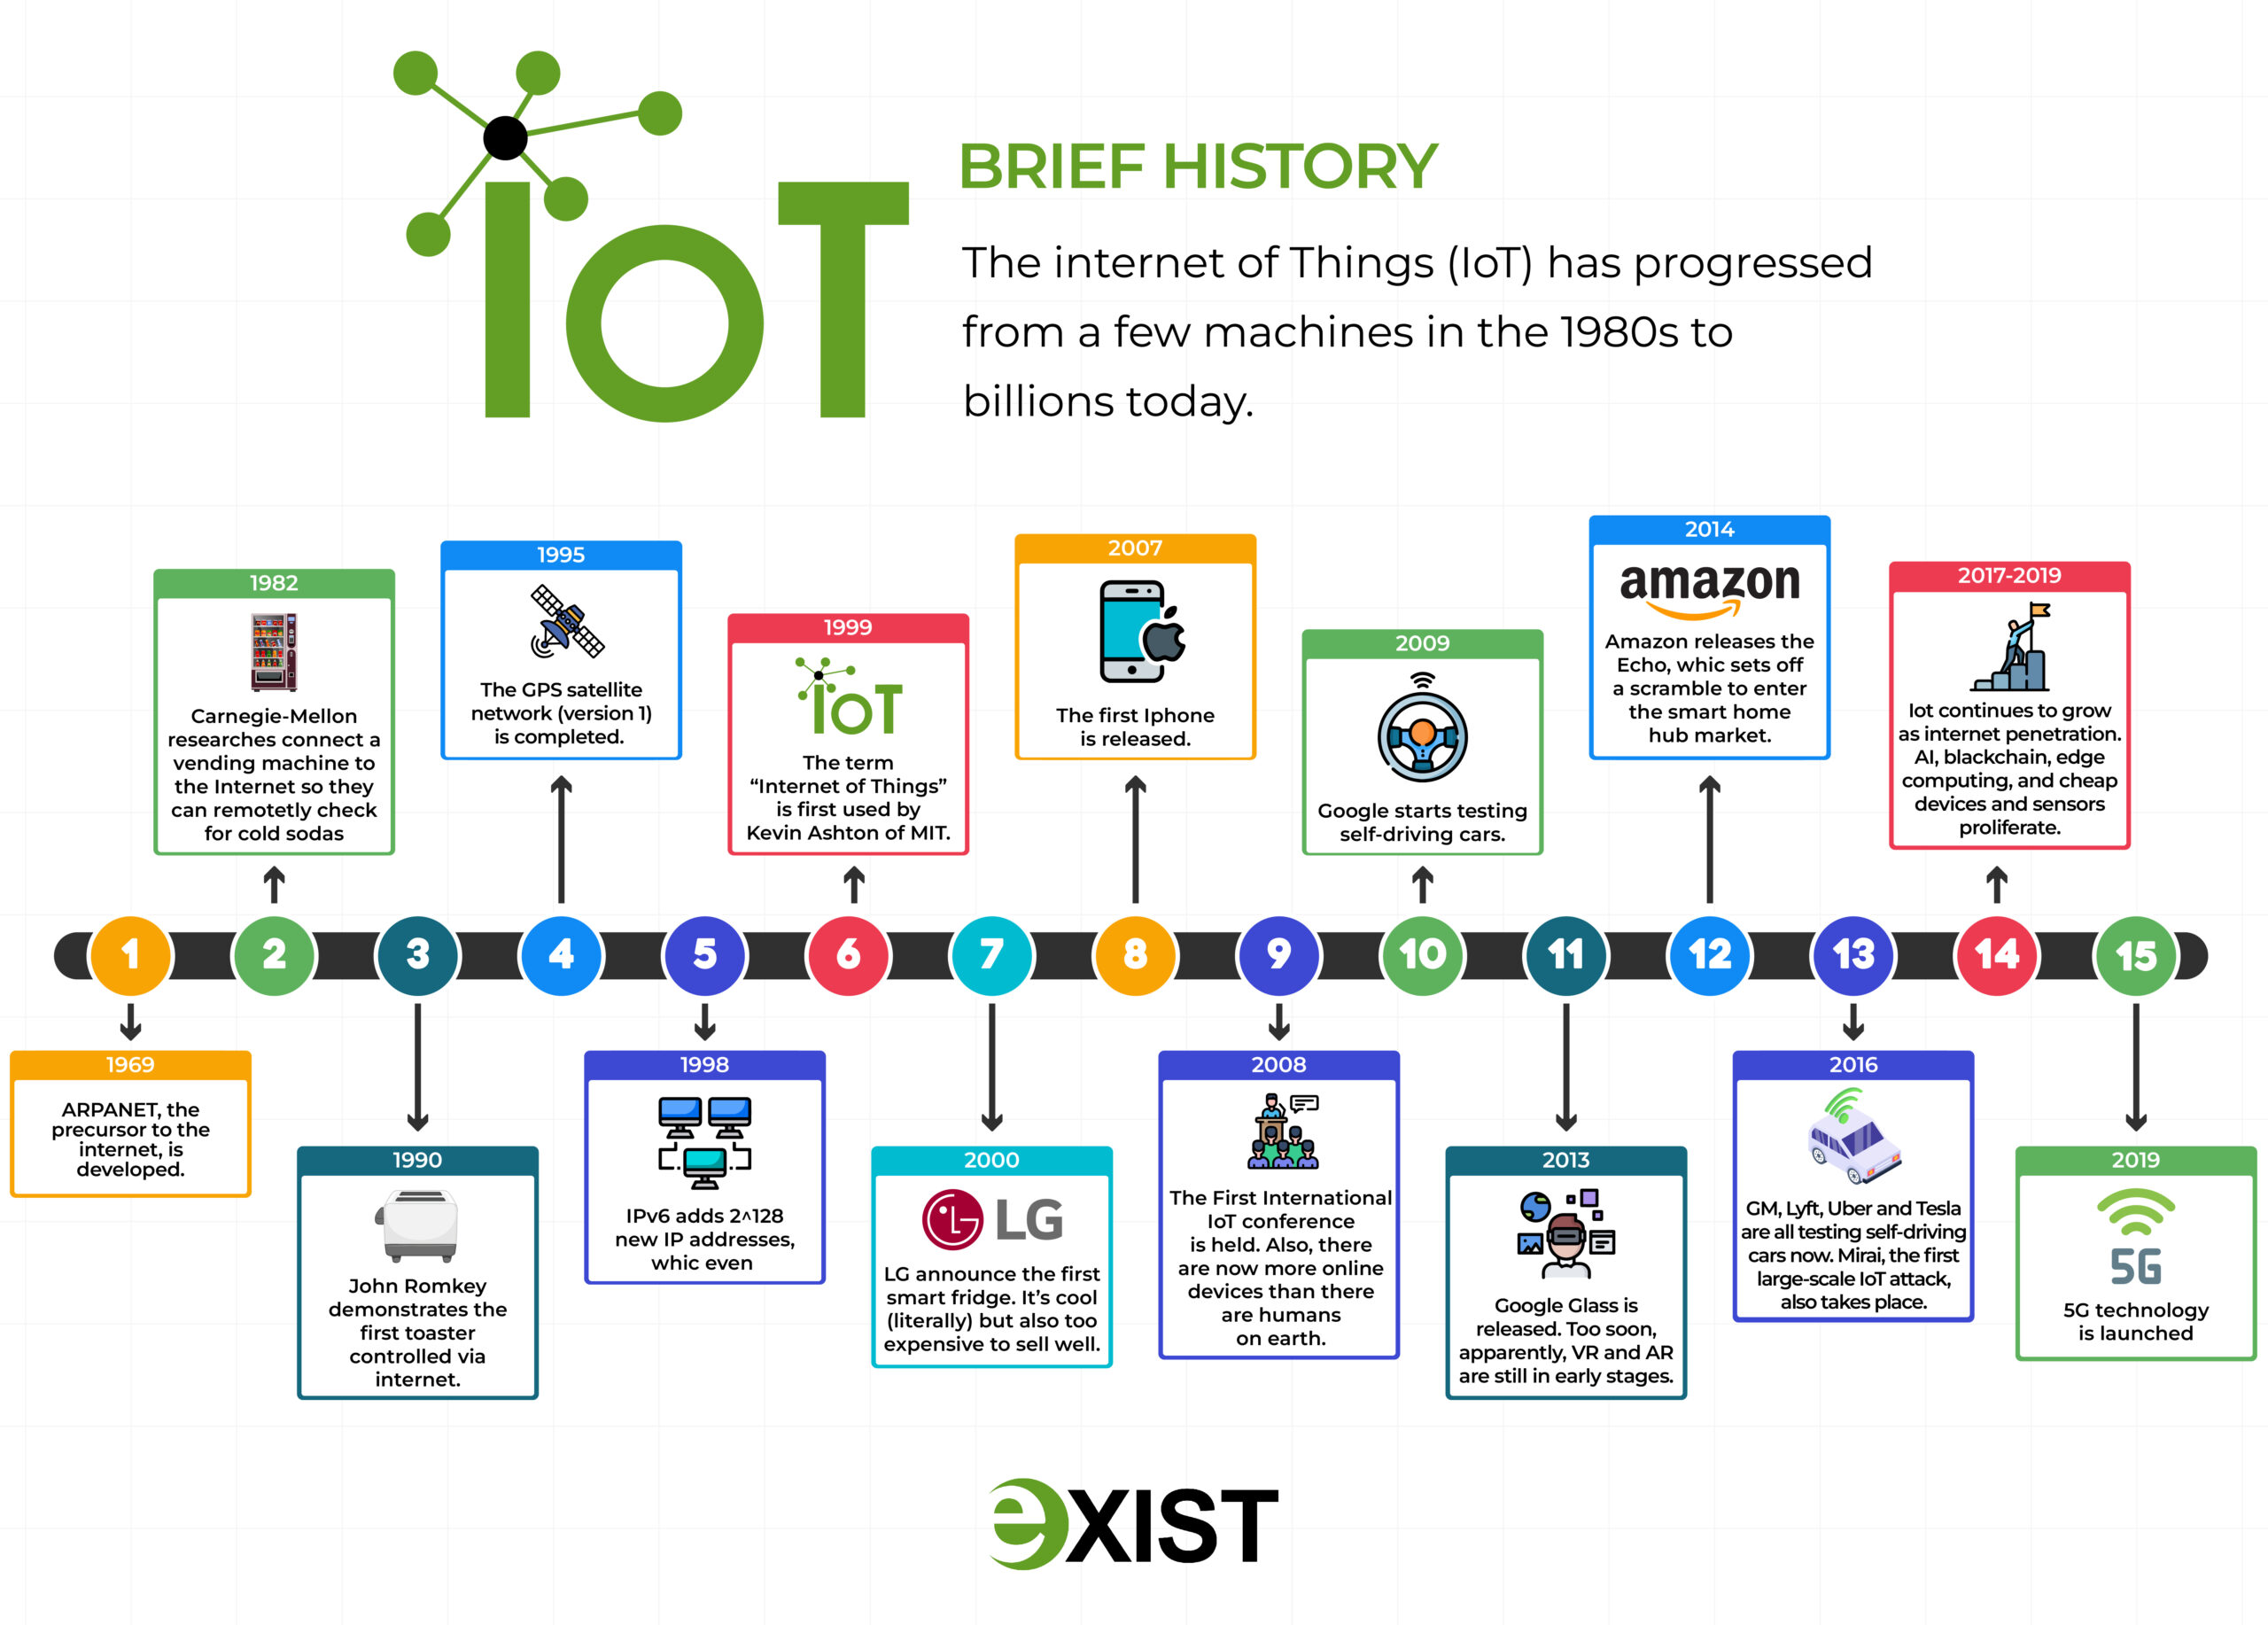
While the tech-world is abuzz with this and a lot is happening in this space, it's probably best to first get some basics in mind, and the infographic below helps us to grasp the evolution of these things over the years.


(Ctrl+Click to enlarge)


(Ctrl+Click to enlarge)

Sunday, October 5, 2014

[Infographic] 8 Emerging Tech Trends You Can't Ignore

The world today is flush with new trends, many of them technologically centered. Mobiles and the cloud are now ubiquitous, having (or almost) reached many hitherto remote corners in the civilized regions. These disruptive trends are - and will continue to - affect the lives of the human populace increasingly. What is mind boggling is the rate of change and adoption in these.

So, whether you are a tech-savvy person or not, it would help to know the tech trends that are on the horizon, coming at you at breakneck speed.

Click on the image to view in full size

Click on the image to view in full size
(Via Pinterest)

Sunday, May 4, 2014

[Infographic] The Power of Analytics

Big Data (see post: [Infographic] The Real World of Big Data), powered by Hadoop (see post: Making Big Data Work: The Hadoop Family) is as much a reality as a challenge or an opportunity, depending on how one looks at it. While working with Big Data entails many things, including optimally addressing the 4 V's: volume, velocity, variety and veracity (see post: [Infographic] The Scale & Scope of Big Data), the value to be unearthed is no doubt a subject and application of deep analytics.

The infographic below distills the surrounding complexities and lucidly brings out the manner in which the power of analytics can enable business growth, led by strategic use of data.

The Power of Analytics
Click on image to view in full size

Source: https://dataconomy.com/wp-content/uploads/2014/04/BigData_wIPRO.jpg
Note: The original infographic by Wipro was linked from a different source, which is no longer available, and the link to the infographic has been updated suitably.

Sunday, March 9, 2014

[Infographic] Wearable Technology Application Chart

Wearable Technology is seemingly the new frontier as the world is already saturating on the social media, cloud computing and mobile technologies. It's not a space that many are or may be familiar with, but is something many believe needs to be watched closely. Here's a quick look into the world of wearable technology.


(Source: Beecham Research - http://www.beechamresearch.com/download.aspx?id=36)

Sunday, September 1, 2013

[Infographic] The Real World of Big Data

Big Data is here to stay (See post: [Infographic] The Scale & Scope of Big Data) and every day, organizations around the world are working towards identifying what they can leverage this for, or what their big data strategy needs to be, to compete in the digitized world of the 21st century and beyond. Clearly, the answers are not easy, and it will be some time before they figure it out.

Today's post provides an infographic from Wikibon that provides useful insights into what the areas of focus in the big data context can be, their potential (in dollar value terms, that is), and what some early adopters in the real business world are applying big data for.

Click image to see a larger version
 The Real World of Big Data
The Real World of Big Data
via Wikibon Infographics

Saturday, July 27, 2013

[Infographic] The Scale & Scope of Big Data

The world is a more connected place today, and the exponential growth of disruptive technologies like social, mobile and cloud has led to an unprecedented challenge: that of an unimaginable scale and velocity of data creation. While the 'first wave' of this has been driven by humans through mediums like social networks, there is more to come: the data generated by smarter and intelligent machines. While machines and systems are already capable of doing so, the next wave (think the 'Large Hydron Collider') promises to be even more explosive!

Data is going to be the new currency of the digital age - and businesses that have access to data are scrambling for ways and means to make sense of it, a far cry from the 'information' that it has been seen as, thus far. Big Data is therefore, more of a problem, than a solution in itself. If - and there's probably not much choice not to - one wishes to address the problem and it's challenges, one has to begin understanding a lot more about Big Data.

An earlier post - The Future of Big Data - emphasized the context to the growth of big data, and how it's going to be around. Here is more on this, but with an attempt to help grasp the scale and scope of what it encompasses, and the themes it touches on. A better understanding of the problem is needed, if a solution has to be devised. It's not going to be an easy problem to address, but the good news - you may not be alone breaking your head over it!

Note: This post was updated to provide new infographics than were originally included, as the original content/infographics were removed by the source party/service. We apologize for the inconvenience, but hope the updated ones will provide equivalent information.

Setting the Scale of Big Data:
Click to see larger version


Big Data Snapshot:
Click to see larger version


Sunday, July 14, 2013

[Infographic] Car Tech Countdown to 2018

Technology is advancing at a rapid pace, what with the advent of the mobile revolution, and technologies powering it. The mobile phone is touted to be THE single most important device (or tech) that will power people's lives in the next decade.

The technologies for such devices are no doubt finding new applications, and one such area that is seen to be impacted greatest, is likely to be that of personal travel: the car. With Google's self-drive car being cleared for road driving in some places, the future isn't really that far, some say.

Here's a peek into what the future of Car Tech holds in the next 5 years:
(Note: The image from the original source: http://www.landlautomotive.co.uk/mercedes-benz/news-and-events/car-technology-countdown-to-2018.aspx is no longer available, hence we're updating this to another one.)


Monday, June 3, 2013

[InfoGraphic] It's a SaaS World

ProfitBricks has just published an infographic that describes the history of Software-as-a-Service (SaaS), how it compares to other cloud service delivery paradigms such as Infrastructure-as-a-Service (IaaS) and Platform-as-a-Service (PaaS), and the leading SaaS types in use across the world today.

It's a great primer for one and all!


Courtesy of: ProfitBricks - Cloud Computing 2.0 via https://thetechpanda.com/ (updated, since ProfitBricks became part of Ionos.com)


Thursday, May 2, 2013

[Infographic] Google Glass From the Inside

Early last spring, Google announced the advent of Google Glass -sporty and snazzy piece of the new generation of wearable computing technology. Google Glass is being readied, with the first pieces of the sci-fi style glasses being ready to be shipped by late 2013 (we gather).

If you are keen, then the specs include a tranparent LCD or AMOLED display, a front facing camera, GPS, motion sensors, Wi-fi or Bluetooth enabled, running Android. (For the full specs, see this)

If you want to know how Google Glass works for the user, then check it this video.


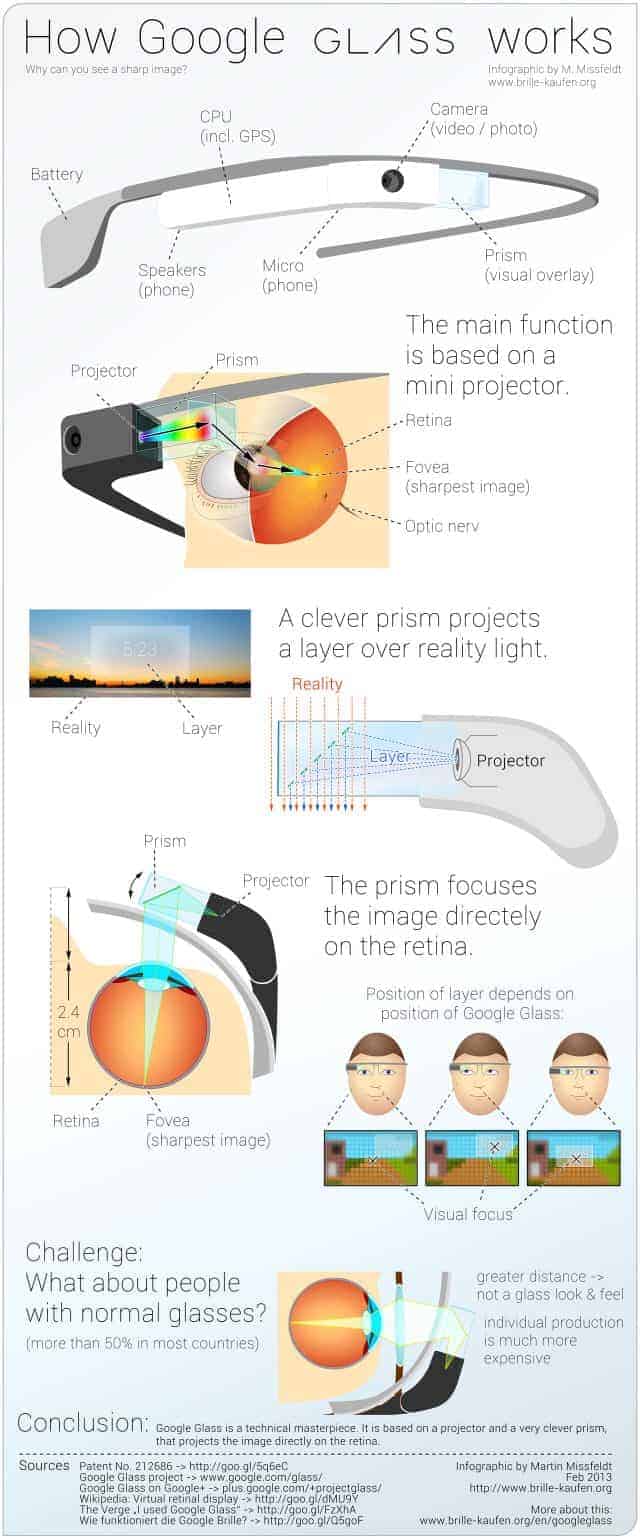
If you're curious to know how it really works - internally, that is - then check out this great infographic (by Droid-life.com) below.


(Click on the image to view full size)

Sunday, February 24, 2013

Making Big Data Work: The Hadoop Family

Click to visit the Apache Hadoop page
Big Data is not just a buzz word today - it's probably a precursor to the stark reality in the increasingly digitized world of Twitter, Facebook, Pinterest, Instagram, Apple iOS/iPhone and Google Android (see post: [Infographic]: Amazon Web Services - Behind the Scene).

It's not just the technology and Cloud-service vendors who are interested in big data. It's a growing number of retail businesses, utility companies, and more (see post: [Infographic]: The Future of Big Data). The volume of data generated every moment continues to rise, and is expected to grow as more 'smart' devices enter our personal and work environments.

Indeed this is exciting in itself, and quite unprecedented in human history, questions abound in everyone's minds. While there are no easy answers, one thing that we're watching is the evolution of the technology that can make all this worth it - the handling, the processing, the scaling, the 'smart' analytics, driving the intelligent business of tomorrow.

So, with all the buzz around Big Data, we thought its best to devote a post to these set of technologies. And, one such technology - rather, suite of technologies - is Hadoop and it's related tech components. The Apache™ Hadoop® project develops open-source software for reliable, scalable, distributed computing, and has evolved through many years now, with companies like Yahoo!, Google and Facebook contributing significantly to it.

To understand big data better, it's important to get an understanding of some of these core technology components, and here you'll find 3 great slide decks on the topic. (Thanks to the folks for sharing these and making them available)


Saturday, January 26, 2013

[Infographic] The Future of Big Data

A visualization of Wikipedia edits (by IBM)
As the industry and consumers begin to come to terms with Cloud and Mobile technologies, there's already a new buzz that's creating waves and excitement. Big Data - some of you'll may have heard it, while for most others, it may conjure up different images.

According to Wikipedia:
"big data is a collection of data sets so large and complex, it becomes difficult to process using hands-on database management tools or traditional data processing applications. The challenges include capture, curation, storage, search, sharing, analysis and visualization..."

With the rise of social technologies, powered by the digital, mobile and portable devices, the volume and variety of data passing through the cloud is unprecedented in scale. Add to that, the increasing non-PC and non-phone-like devices (i.e. machines) which can generate thousands of bytes of data per second, and we have a BIG problem - capturing, storing and analyzing this unstructured data to derive meaningful information - for the users, for the business, for all those who care! That's what Big Data is all about.

So, is this only a passing buzz, hyped by the ones who are good at it? Well, possibly not. Here's an infographic that summarizes all about Big Data - now and for tomorrow - for you. With Big Data, it can't get any simpler than this!

The Future of Big Data
click to enlarge