
 |
| Source: visual.ly |
These are mind boggling numbers, and the rapid rise and penetration of mobiles on our planet has only accelerated this. But, if you take a moment and ponder, a lot of this has been made possible by one emergent technology: cloud computing.
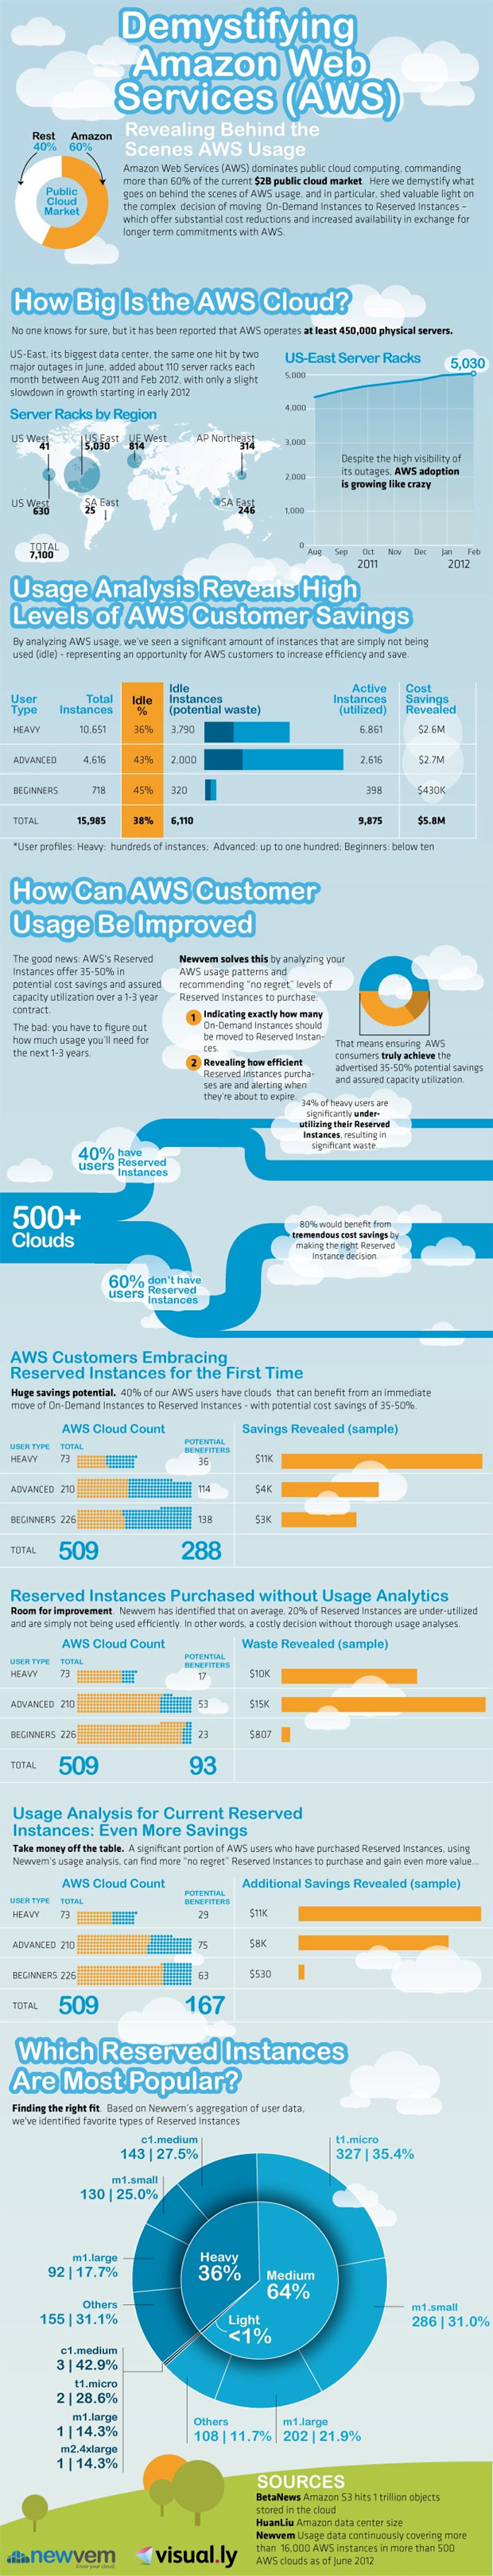
Cloud Computing is huge, and there's a lot of hype about this, and there's a lot of work that's currently underway. Amazon Web Services (AWS), one of the pioneers in this space, has been leading the pack in a number of ways through their Infrastructure-as-a-Service (IaaS) services.
So, how big is the Amazon Web Services Cloud? Just as interpreting, processing and even storing huge data is an interesting challenge, and require new tools and techniques. Likewise, thanks to Infographics - a visualization of information for convenient understanding, this can be a tad easier, thanks to the team of thecloudinfographic.com. Here's a nice infographic to understand the size of the AWS Cloud.

No comments:
Post a Comment